DT Headers Dyno Result Thread (1 Viewer)

This site may earn a commission from merchant affiliate
links, including eBay, Amazon, Skimlinks, and others.

Joined
Sep 19, 2010
Threads
61
Messages
2,918
Location
Lost in the Sierras
Website
rob.red
DT Headers Dyno Result Thread (Numbers are in)

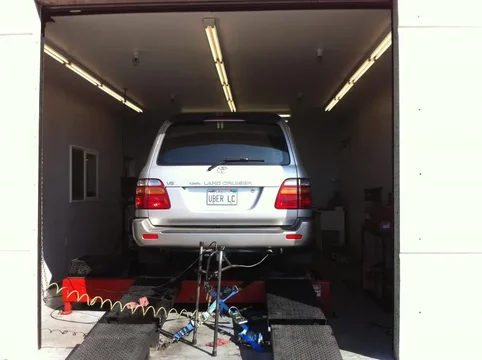
This is the baseline dyno run for the DT headers Install. We are scheduled to make the followup run 9/8. Headers will be installed 9/2 and I will attempt to put some break in mileage on them before the second run.

The Mileage figures represent when the last service was done. Items listed are for contextual purposes to better understand the state of tune this truck is in and how that could effect readings. Please keep in mind that every single dynamometer will give different numbers. These numbers may appear high or low depending on your side of the fence. That isn’t important. The value of these results and comparisons should provide information on the relative difference adding the DT headers to a stock truck can make.

Vehicle: 2000 Toyota Land Cruiser
Mileage: 146,019
Configuration: All Stock

Variables:
Spark Plugs: OEM @ 139,003 miles
Airfilter: OEM @ 139,003 miles
O2 Sensors: Original @ 0 miles
Fuel: Chevron (CALIFORNIA) 91oct
Engine Oil: Mobil 1 5/30 @ 143,752 miles
Diff / XFer Oil: Mobil 1 75-90 @ 143,804 miles
Driveline Lube: Sta-Lube Extreme Pressure Moly @ 143,804 miles
Throttle Body: Cleaned @ 143,804 miles
Tires: Kelly Safari Trex 5/32 tread/OEM Diameter/36PSI cold pressure

Environment:
Land & Sea Pro 1000 All Wheel Drive Chassis Dyno
Altitude: 40’ above sea level
Air Temp in Bay: 77*
Ambient Air Temp: 68*
Intake Air Temp: 105*
AT temp: 135*
Coolant Temp: 193*
Gear Selection: 2nd Gear Used (power ECT was off)

Results:

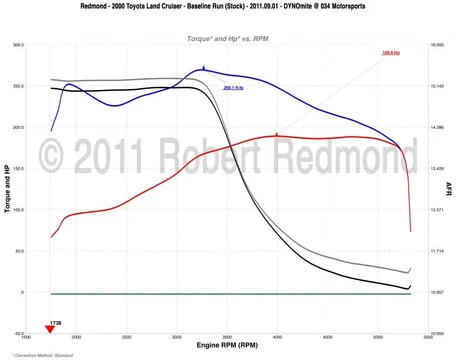
Wheel Horsepower: 188.8 @ 4000 RPM

Wheel Torque: 269.1 @ 3250 RPM

* Averaged or merged over 4 back to back runs. Each run had a 2 minute interval between them.

IMG_0235.jpg

Actual Dyno Charts Will follow below so you can see the AFR and power curves. Torque is flat to peak and horsepower builds in a linear fashion to peak.


---
IMG_0235.jpg
 
Last edited:
So you want some Dyno results huh?

First let me say thank you for the support on this project from some key forum members;
Nakman, Plirky, SR.GRINGO, OregonLC, Romer, Lexi4Darin, Copenhagen1, SMM3, db2nsoaz, Supra88, Uzj100, Skolfoppa, CappyKD. You guys provided the financial support to do this project.

If you haven't looked at the above baseline run please take a moment and do so. This will give you the context for the next several comments.

Initially I posted a baseline run that yielded 205 horsepower. Wow that's great, but very unexpected. I was expecting 160-180 so to say I was shocked was an understatement. I suspected something might be up (OregonLC also hinted this) but I wanted to give you guys some progress on this so I posted what we had. Today I got access to the Dyno for the follow-up run and I had an opportunity to pour over the data collected from the previous "shockingly good" run. After reviewing the data sets and the output curves I have concluded that indeed the initial run I posted isn't the correct one. In 8 out of 10 pulls the HP curve looked a lot different. In two pulls you got what I initially posted. After looking at many variables on the pulls I have concluded that HP number initially posted was wrong. I have corrected the above post with an updated plot and associated data. I'm sorry for any confusion this might have caused but I am now solid on what is posted, both before and after.

When Interpreting this data it's important to note that the DT Headers provided a gain everywhere, not just peak numbers. Drivability has been improved through out the rev range as well as more torque and HP at every RPM. The Land Cruiser makes over 200 ft-lb of Torque from at least 1900 RPM (the lowest we measured) to Redline. Not too bad.

Dyno Run
Vehicle: 2000 Toyota Land Cruiser
Mileage: 146,132
Configuration: Stock + DT Headers

Variables:
Spark Plugs: OEM @ 139,003 miles
Airfilter: OEM @ 139,003 miles
O2 Sensors: Original @ 0 miles
Fuel: Chevron (CALIFORNIA) 91oct
Engine Oil: Mobil 1 5/30 @ 143,752 miles
Diff / XFer Oil: Mobil 1 75-90 @ 143,804 miles
Driveline Lube: Sta-Lube Extreme Pressure Moly @ 143,804 miles
Throttle Body: Cleaned @ 143,804 miles
Tires: Kelly Safari Trex 5/32 tread/OEM Diameter/36PSI cold pressure

Environment:
Land & Sea Pro 1000 All Wheel Drive Chassis Dyno
Altitude: 40’ above sea level
Air Temp in Bay: 75*
Ambient Air Temp: 66*
Intake Air Temp: 99*
AT temp: 127*
Coolant Temp: 192*
Gear Selection: 2nd Gear Used (power ECT was off)

Results:

This is peak - Look at the curve. There are rpms where the improvement is better than the peak difference.

Wheel Horsepower: 210.4 @ 4150 RPM (Gain of 21.6HP / 10.2%)

Wheel Torque: 281.4 @ 3200 RPM (Gain of 12.3 ft-lb / 4.3%)

* Averaged or merged over 3 back to back runs. Each run had a 2 minute interval between them.
final.jpg

blended.jpg
final.jpg
blended.jpg
 
Last edited:
Surprises me to see the stock HP number that high. I would have expected to see the wheel number in the 180's or so.

Thanks for taking the time to do the run.
 
Good stuff, glad you put this together. Can't wait to see the post DT install numbers. What about O2 sensor ages?
 
:popcorn:
 
appreciating the effort!
 
Thanks for doing this.
 
nakman said:
Yeah thanks again guys.. not sure if your initial numbers are good or bad, but it's funny reading through all your variables how similar our trucks really are. Looking forward to the after numbers next week!

I had to list the variables. Some guys on this forum would question the results based on if I have wood on the dash or not.
 
Yes, thanks. Great information, even for those that do not currently have the headers. :beer:
 
Just curious in the drop in power between 4100 and 4800 approx, what happened there, traction loss?
 
Pretty normal stuff for any engine.

Not in my book, you lost power from 4100 to 4400, then started to gain again at the same steady rate that you were before the fall. You didn't change gear so either the smoothing software has caused this, a load step in the dyno or fuel or air, timing or something. Your vehicle is not VVTI so it's not that.
My thoughts only.
 
I've dyno'd quite a few vehicles and it's quite normal to see peaks and valleys in the power curve. We are looking at a smoothed plot but that's not accounting for the changes you're pointing out. These variables can be a number of engine factors making peaks and valleys.

More over it's normal for a 2000 Land Cruiser, we dyno'd a second LC just 10 minutes later to answer these types of questions. The curves were identical.

Time to up date your book ;)
 
........ we dyno'd a second LC just 10 minutes later to answer these types of questions. The curves were identical.
So it's either engine management doing this or something in the software or dyno? I expect the software/dyno. It would be nice to see some other runs on a different brand of dyno. Here's one from a Tundra, a continual increase in power as I would expect.
1007tr_12+2007_toyota_tundra_buildup+dyno_results.jpg
 
Check out the tundra pull on the DT website. Same types of dips, different dyno. You also are referencing a VVTI engine which I expect to be smoother.

The plot you just posted is so smoothed and adjusted you will never see the dips.

So it's either engine management doing this or something in the software or dyno? I expect the software/dyno. It would be nice to see some other runs on a different brand of dyno. Here's one from a Tundra, a continual increase in power as I would expect.
1007tr_12+2007_toyota_tundra_buildup+dyno_results.jpg
 
I know it is smoothed, so is yours.

I'm not here to argue, just discussing and trying to learn.

But if it were my engine, then I'd want to know why there is a significant reduction in power between 4100 and 4400 and why it takes a total of 800 rpm to regain it.
Is it the engine ECU or is it the dyno?

If it's the engine ECU, is this the "detuning" that Toyota builds into it's engines so they can realize "a bit more power" in each proceeding year model by changing the mapping in the ECU each year?
 

Users who are viewing this thread

Back
Top Bottom